Your Smarter Greener Neighbourhood – PPGIS survey results from Kalasatama and Kuninkaantammi
14 February 2022
Elina Nyberg
Which places do you value in your neighborhood in terms of aesthetics, biodiversity, and outdoor activities, and which views and sounds help you relax and forget about everyday worries?
How pleasant do you perceive different landscapes such as parks, private yards, water areas or forests in your own neighborhood?
Where do you experience positive and negative sounds and how pleasant or unpleasant are different sounds like bird song, children playing, or transport to you?
Over 500 people mapped places they value and places where they experience positive and negative sounds in their neighborhood
A total of 508 people answered the survey, 305 in Kalasatama and 202 in Kuninkaantammi. Respondents mapped in total 3600 values and sounds in Kalasatama, and 2376 in Kuninkaantammi. Respondents were most often aged between 30-60 (65 % of all respondents), Finnish speaking (82 %), and had a higher education degree (71 %). Especially in Kalasatama, over a third of the respondents who mapped their home locations had lived there for a relatively short time, on average two years or less.
People mapped outdoor activities and pleasant sounds most
In both areas respondents mapped pleasant sounds, aesthetic values, and outdoor activities the most (see pictures 1 and 2). The difference between the areas in terms of urbanity and location could be seen in the mapping of urban life (higher in Kalasatama) and biodiversity values (higher in Kuninkaantammi). We only analyzed value points that were in the two residential areas and within a kilometer of the initial study area in more detail.
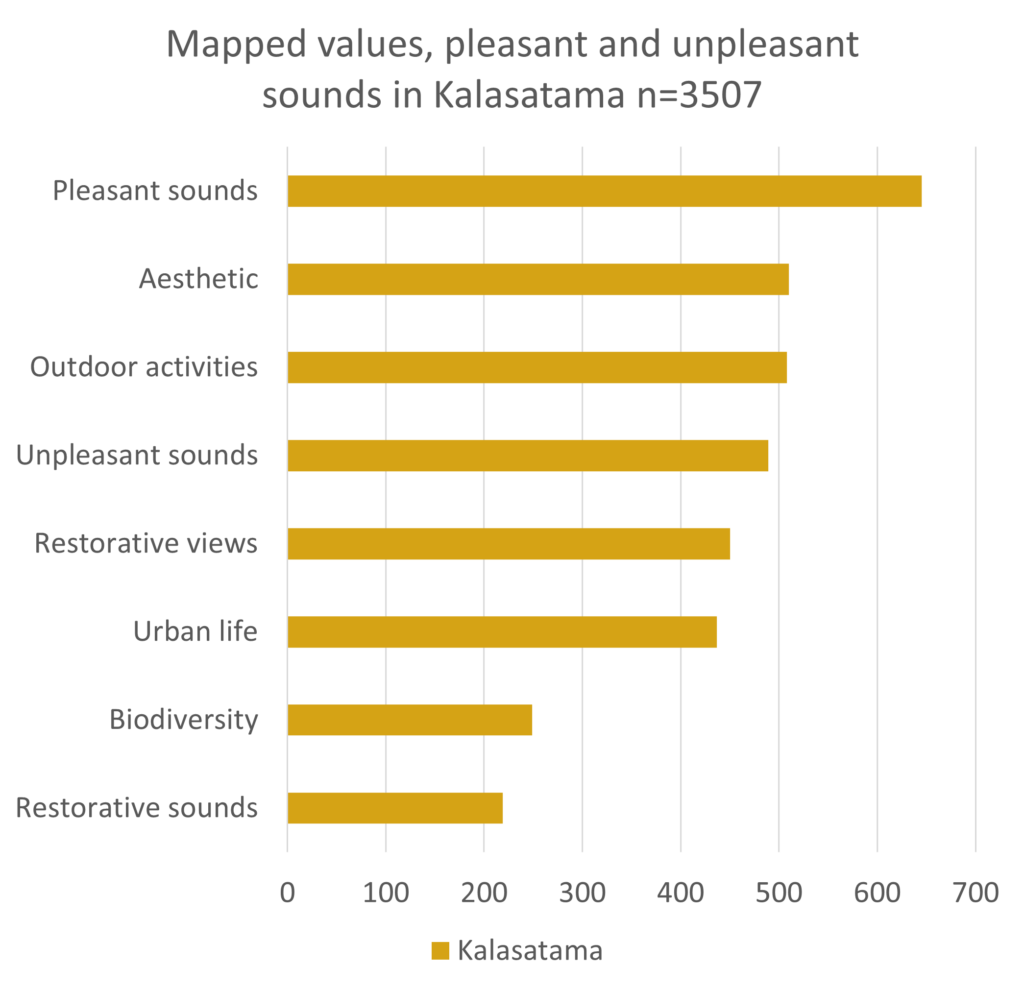
Picture 2. Pleasant sounds, aesthetic values and outdoor activities were mapped most in Kalasatama.
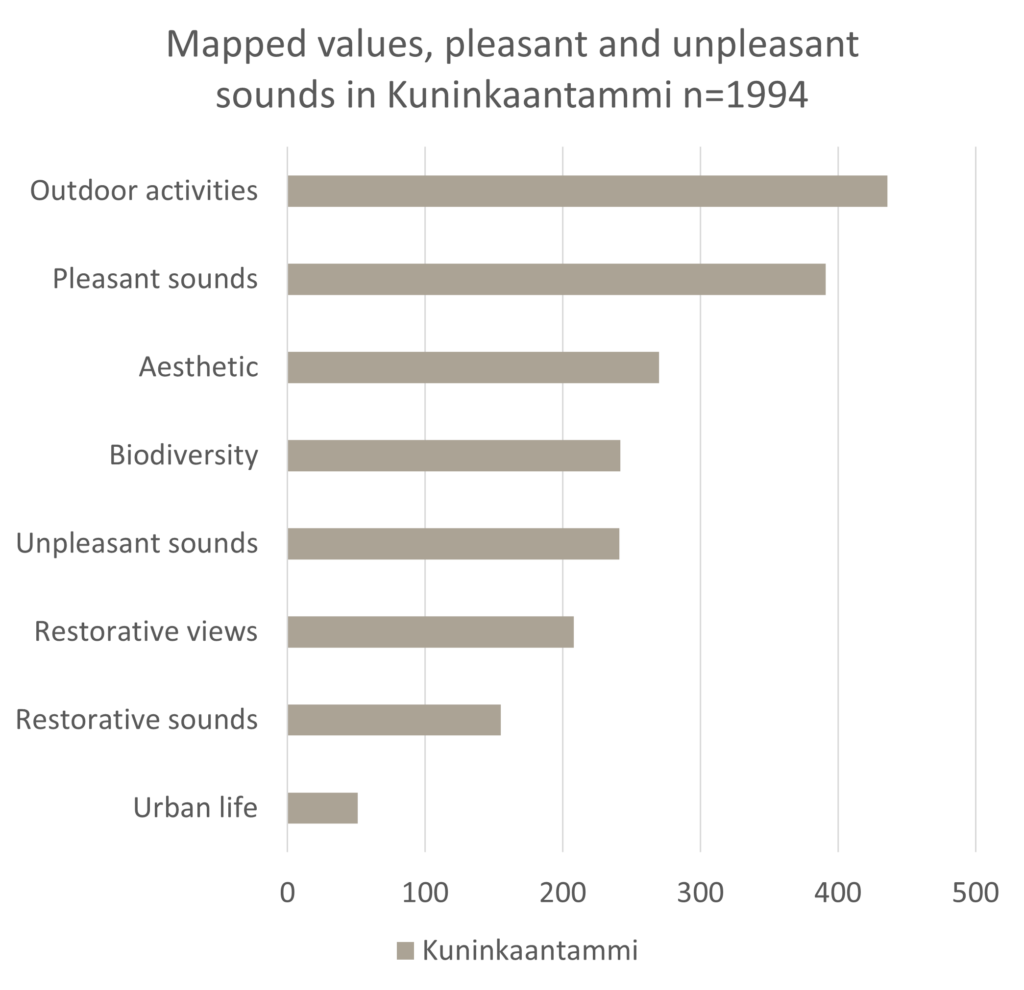
Picture 1. Outdoor activities, pleasant sounds and aesthetic values were mapped most in Kuninkaantammi.
Water areas and larger green spaces are important to the residents in both neighborhoods (see pictures 3 and 4)
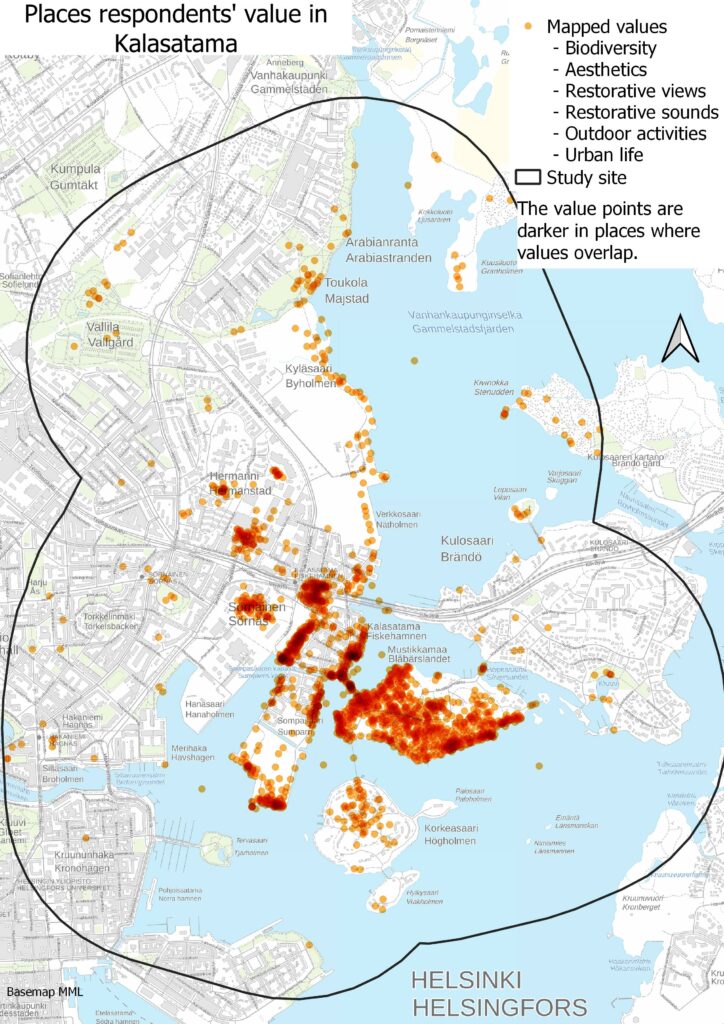
Picture 3. The places respondents value in all categories in Kalasatama. The values points are darker in places where value points overlap.
Restorative sounds were situated near water, especially on the southeastern parts of the recreational island, Mustikkamaa and on the riversides of Vantaanjoki.
In Kalasatama biodiversity values were concentrated in Mustikkamaa, especially in the inner more wooded parts of the island. In Kuninkaantammi most biodiversity values were mapped around a grove on the riverside of Vantaanjoki. Also, large forest areas in Keskuspuisto central park and smaller wooded areas around the residential area were experienced as important. In addition to the larger wooded recreational areas, outdoor activities were situated in novel and recently established parks and beach areas.
Restorative views and aesthetic values were distributed around the shores and riversides and in parks such as Kalasatama park or Helene Schjerfbeck park. In Kuninkaantammi elevated places like hilltops and cliffs provided restorative views and were often valued for aesthetics as well.
The respondents marked urban life values in places with restaurants, shops, and events, such as the shopping center Redi or the southeastern shores of Kalasatama. In Kuninkaantammi, only few urban life points were mapped, and these were situated at the core of the residential area. In Kuninkaantammi residents mapped half of the urban life points in centers outside the neighborhood.
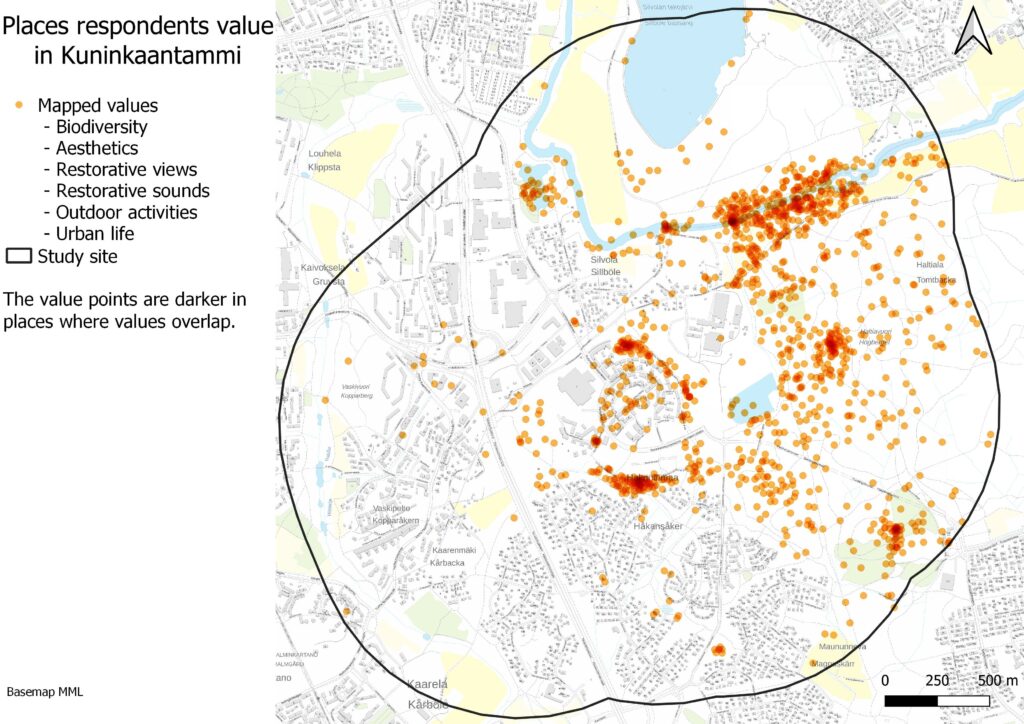
Picture 4. The places respondents value in all categories in Kuninkaantammi. The values points are darker in places where value points overlap.
Natural sounds and landscapes were perceived most pleasant by respondents
People perceived natural landscapes and sounds most pleasant in both areas. Forest and sea landscapes, water sounds, and bird song were perceived as pleasant by most respondents. In addition, pleasant sounds overall were often placed in green and water areas (see pictures 5 and 6). Relaxing water and sea views, and the closeness of larger recreational areas were important reasons to move to the areas. Children playing and street music were often seen as pleasant or neutral sounds. However, these divided opinions and some Kuninkaantammi residents felt that street music was more linked to city centers and urban life. Some people saw the construction phase of parks and yards unpleasant. Unpleasant sounds were situated next to incoming routes, roads, and construction sites in the built environment (see pictures 5 and 6).
The participatory mapping survey was carried out by the University of Helsinki (HY) and Finnish Environment Institute (SYKE) in Spring 2021 to the residents living in Kalasatama and Kuninkaantammi in Helsinki, Finland. The aim of the survey was to understand what kinds of environments and soundscapes residents value most and which kinds of sounds they perceive pleasant or unpleasant in neighborhoods ongoing change. The researchers in charge of the study were Silviya Korpilo
(HY), Kati Vierikko (SYKE), Elina Nyberg (SYKE), Hanna Nieminen (SYKE), and Leena Kopperoinen (SYKE).
Links to the Kalasatama and Kuninkaantammi surveys.
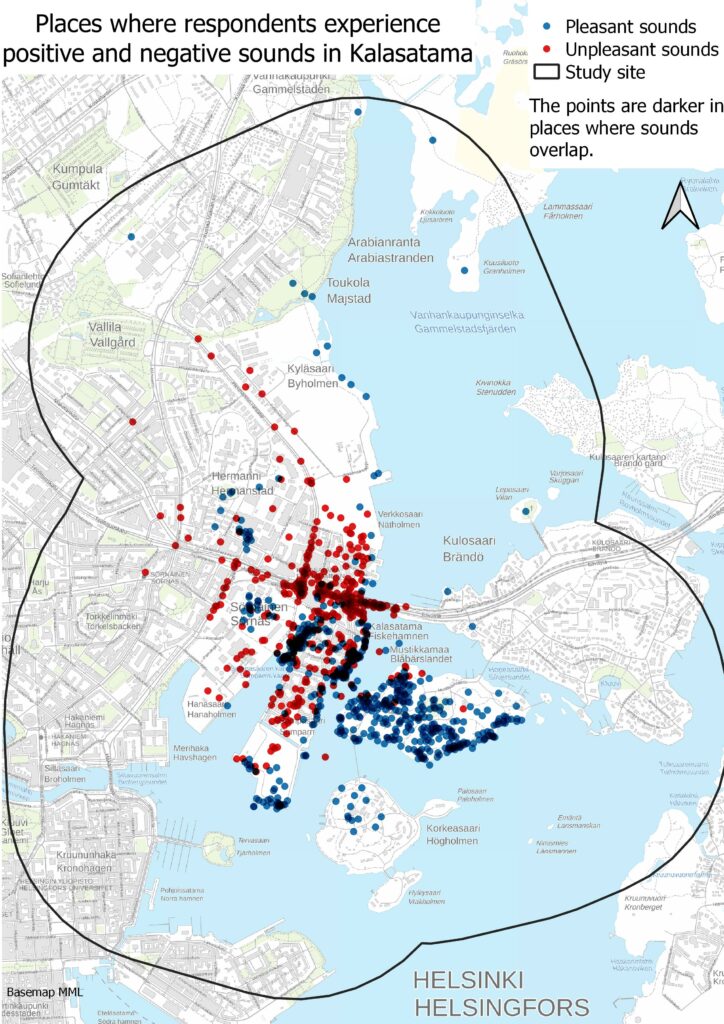
Picture 6. The places where people experience pleasant and unpleasant sounds in Kalasatama. The points are darker in places where sound points overlap.
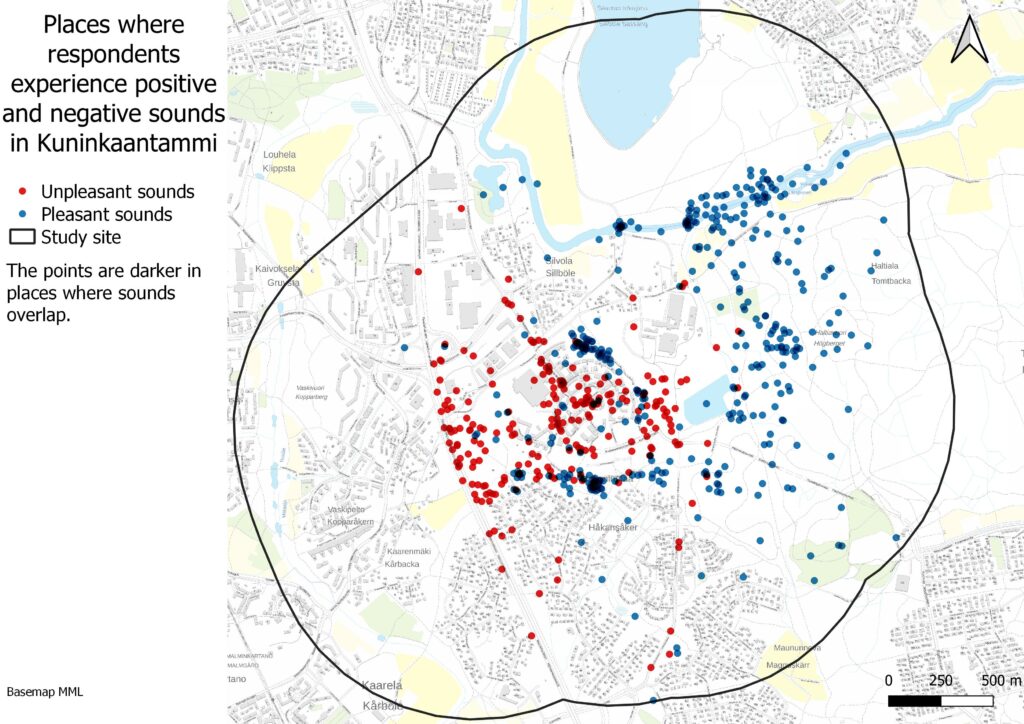
Picture 5. The places where people experience pleasant and unpleasant sounds in Kuninkaantammi. The points are darker in places where sound points overlap.
Project coordinator Associate Professor Erik Andersson, erik.andersson(at)su.se
Stockholm Resilience Centre (SCR), University of Stockholm
Project funder: